Collect
Connect PLCs, sensors and SQL databases through production-ready drivers and scheduled logging.
TwinCoreX is a cross-platform industrial visualization twin platform that turns PLC, sensor and SQL data into live graphical twin screens, dashboards, threshold values, analytics, reports and connected data services.
TwinCoreX follows the real engineering workflow of an industrial project. Build the data foundation first, create the visual model, then give operators and connected systems the views and data they need.
Create communication nodes for MQTT, Modbus TCP, Siemens S7 or Ethernet/IP. Enter the controller address, polling interval and tags, then watch node and scan status.
Configure reusable SQL data sources. Create datalog nodes, map driver tags to database columns and choose how often TwinCoreX records them.
Organize locations, plants, areas, systems and equipment in the asset hierarchy. Draw screens with shapes, pipelines, SVG graphics and navigation, then bind live tags to visual properties and animations.
Engineers configure in Edit mode; operators use Runtime mode to navigate the live process safely without changing the design.
Build independent dashboards from templates and widgets. Track threshold values, gauges, trends, Sankey flows, heatmaps and tables; zoom by time range and export chart data.
Configure reports once, run them for any date range and export CSV, Excel or PDF. Schedule processed values to external APIs and bridge data between databases.
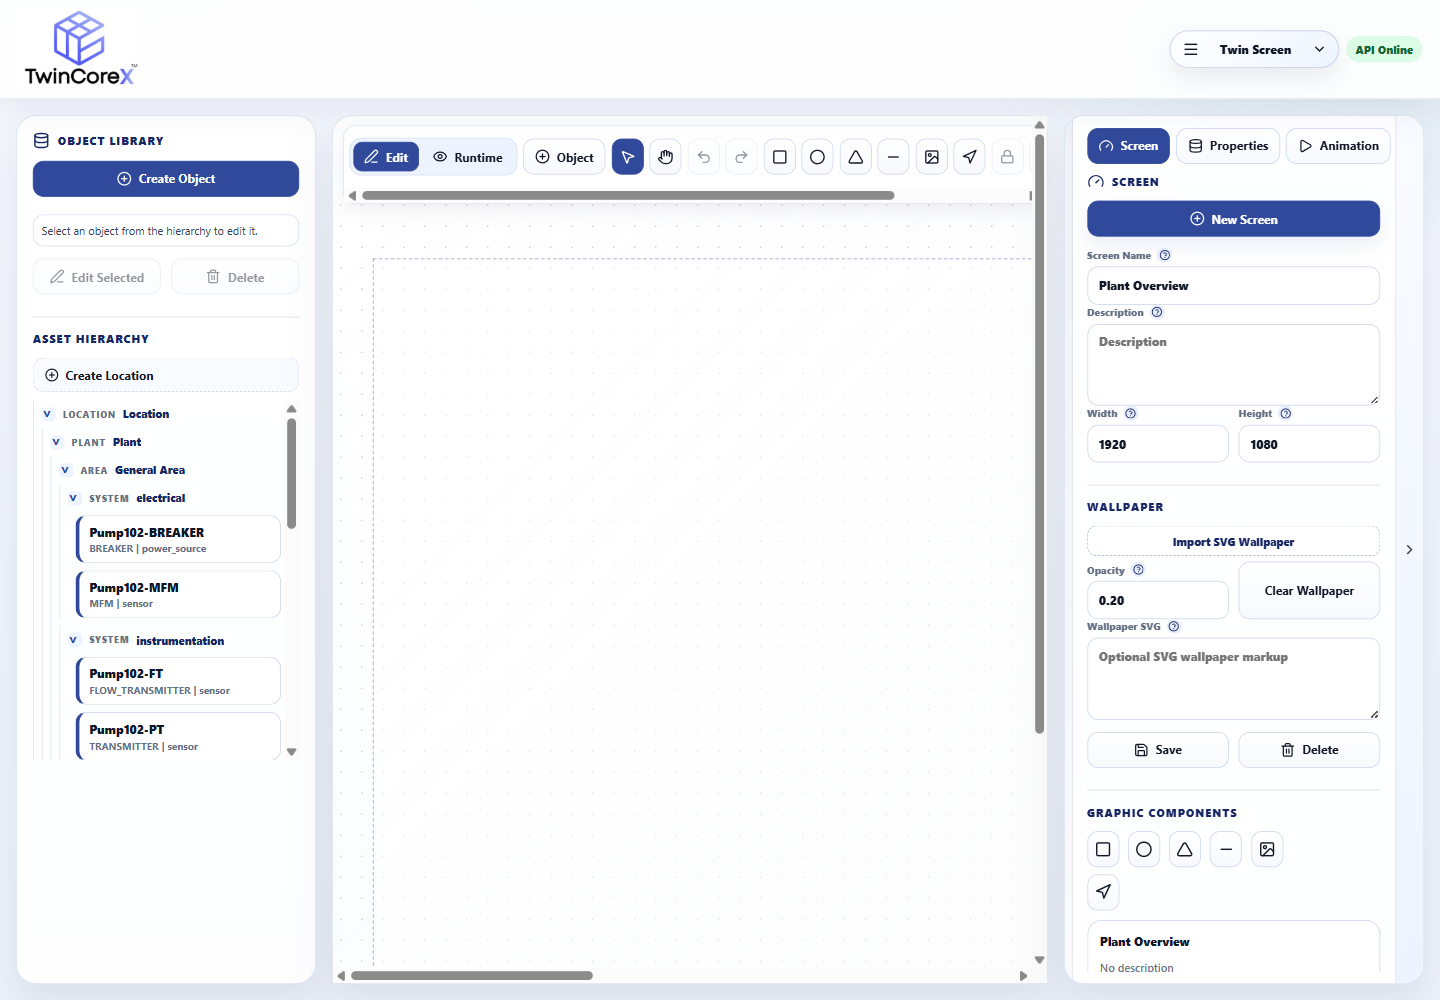
Create asset hierarchies and screens, place industrial graphics, bind live tags and configure animations before switching to operator Runtime.
Replace fragmented tools with a single operational layer built for the realities of modern industry.
Connect PLCs, sensors and SQL databases through production-ready drivers and scheduled logging.
Build a live digital twin and role-ready dashboards with trends, gauges, threshold status and asset context.
Find patterns with Sankey flows, heatmaps and reusable reports for any chosen date range.
Push governed, processed data to connected systems and APIs on a defined schedule.
Select a TwinCoreX module, change its live settings and experience how an industrial project is configured. This guided sandbox runs entirely in your browser and does not save any data.
192.168.1.20:502
Change the fields, then test the node. This mirrors the Communication editor workflow without contacting real equipment.
Any operation that runs on sensors, PLCs and SQL data can be modeled, monitored and improved in TwinCoreX.
Monitor pumps, flow, tank levels and pressure across treatment and distribution networks—with live threshold values and complete historical context.
Collection, monitoring, analytics and publishing live together—without the integration glue.
Poll, log and visualize on configurable intervals so decisions reflect current plant conditions.
Connect MQTT, Modbus, Siemens S7 and Ethernet/IP equipment out of the box.
Keep operational history in your SQL databases with backup, restore and one-way sync you govern.
Choose by deployment role: reporting for existing SQL/SCADA data, plant-level runtime, central digital-twin engineering, or a headless SBC data gateway. TwinCoreX editions support Windows and Linux deployment.
Reporting and dashboards for clients who already have SQL or SCADA data and need focused visualization without plant communication drivers.
Plant-level runtime for PLC and meter communication, datalogging and a local visualization twin—with reporting and outbound integration.
The complete central digital-twin platform for engineering, multi-site operations, advanced analytics, visualization and centralized management.
A headless SBC or Raspberry Pi data gateway for industrial acquisition, local logging, health monitoring and synchronized outbound delivery.
Scroll horizontally on smaller screens. Limited, Local and Outbound describe the operating scope of that edition.
| Feature / Module | Lite | Edge | Studio | Soft RTU |
|---|---|---|---|---|
| Core Reporting | ||||
| Report Viewer / Builder | Yes | Yes | Yes | No |
| PDF Templates + Scheduler | Yes | Yes | Yes | No |
| Dashboard Designer | Yes | Yes | Yes | No |
| Data Connectivity | ||||
| SQL Data Sources | Yes | Yes | Yes | Local |
| Communication Drivers | No | Yes | Yes | Yes |
| Modbus / MQTT / S7 / EIP | No | Yes | Yes | Yes |
| Datalog Nodes | No | Yes | Yes | Yes |
| Publisher / Custom JSON | No | Yes | Yes | Optional |
| Database Bridge / Sync | No | Yes | Yes | Outbound |
| Digital Twin | ||||
| Twin Runtime Screens | No | Yes | Yes | No |
| Twin Screen Designer | No | Limited | Full | No |
| Asset Library + SVG Animation | No | Limited | Full | No |
| Asset Analytics | No | Basic | Full | Health |
| Management + Security | ||||
| Users / Roles / Rights | Basic | Local | Central | Minimal |
| 2FA / Audit Logs | Optional | Yes | Yes | Local Logs |
| Multi-location / Multi-plant | No | Limited | Yes | Site Node |
| Soft RTU Fleet Management | No | No | Yes | Registered |
Lite = reporting · Edge = plant runtime · Studio = central digital twin · Soft RTU = SBC data gateway.
Explore the full platform overview or speak with our team about a deployment shaped around your operation.
Tell us what you need to connect, monitor or analyze. We’ll show you how TwinCoreX brings it together.